Daniel Garza, Meine Boer and I, we organized a 3-days workshop at INRAE/PROSE in Antony, on the basics of metabolic modelling, our new gap-filler, called DNNGIOR and applications of the methodology on microbiomes.
µGrowthDB is a relational database that provides a structure to store different types of microbial growth data. Our main objective is to serve as a comprehensive resource for researchers interested in studying the growth dynamics of microbial species by providing access to growth projects and studies uploaded by other researchers.
We established an international Marine Biodiversity Observation Network (ARMS-MBON) combining standardised sampling using autonomous reef monitoring structures (ARMS) with metabarcoding for genetic monitoring of marine hard-bottom benthic communities.
Here, we present the data of our first sampling campaign comprising 56 ARMS units deployed in 2018–2019 and retrieved in 2018–2020 across 15 observatories along the coasts of Europe and adjacent regions. We describe the open-access data set (image, genetic and metadata) and explore the genetic data to show its potential for marine biodiversity monitoring and ecological research. Our analysis shows that ARMS recovered more than 60 eukaryotic phyla capturing diversity of up to ~5500 amplicon sequence variants and ~1800 operational taxonomic units, and up to ~250 and ~50 species per observatory using the cytochrome c oxidase subunit I (COI) and 18S rRNA marker genes, respectively. Further, ARMS detected threatened, vulnerable and non-indigenous species often targeted in biological monitoring.
We show that while deployment duration does not drive diversity estimates, sampling effort and sequencing depth across observatories do.
PEMA was the main software used for the analysis of the ARMS-MBON data.
Deciphering microbial metabolism is essential for understanding ecosystem functions. Genome-scale metabolic models (GSMMs) predict metabolic traits from genomic data, but constructing GSMMs for uncultured bacteria is challenging due to incomplete metagenome-assembled genomes, resulting in many gaps. We introduce the deep neural network guided imputation of reactomes (DNNGIOR), which uses AI to improve gap-filling by learning from the presence and absence of metabolic reactions across diverse bacterial genomes. Key factors for prediction accuracy are:
reaction frequency across all bacteria and
phylogenetic distance of the query to the training genomes.
DNNGIOR predictions achieve an average F1 score of 0.85 for reactions present in over 30% of training genomes. DNNGIOR guided gap-filling was 14 times more accurate for draft reconstructions and 2–9 times for curated models than unweighted gap-filling.
prokaryotic foundational model which models whole-bacterial genomes as a sequence of proteins ordered by their genomic coordinates on the chromosome and plasmid(s)
a command-line tool and Python/Rust library for metagenome analysis and genome comparison using k-mers. It supports the compositional analysis of metagenomes, rapid search of large sequence databases, and flexible taxonomic profiling with both NCBI and GTDB taxonomies
Hierarchical Modelling of Species Communities (Hmsc) is a flexible framework for Joint Species Distribution Modelling (JSDMs). relate species occurrences or abundances to environmental covariates, species traits and phylogenetic relationships. JSDMs are a special case of species distribution models (SDMs) that take into account the multivariate nature of communities which allows us to estimate community level responses as well capture biotic interactions and the influence of missing covariates in residual species associations. GitHub
Kinbiont – an ecosystem of numerical methods integrating advanced ordinary differential equation solvers, non-linear optimization, signal processing, and interpretable machine learning algorithms. https://pinheirogroup.github.io/Kinbiont.jl/ https://www.biorxiv.org/content/10.1101/2024.09.09.611847v1.full
Statistical Inference of Associations between Microbial Communities And host phenoTypes https://zellerlab.github.io/tools/siamcat
In the following table I describe some terms I usually read/write about.
Term
Description
richness
number of different taxa in a community
evenness
the commonness or rarity of a species
mucin
a family of high molecular weight, heavily glycosylated proteins (glycoconjugates) produced by epithelial tissues in most animals
effective number
refers to the number of equally abundant species needed to obtain the same mean proportional species abundance as that observed in the dataset of interest (where all species may not be equally abundant)
copiotrophs
taxa living in environments rich in nutrients
succession
changes in the presence, relative abundance or absolute abundance of one or more organisms within a microbial community. Its processes can be deterministic or stochastic. Factors that drive deterministic succession fall into three categories: abiotic factors (pH, redox potential), environmental factors (cross-feeding, diet or travel) and biological factors (innate and adaptive immunity). Stochastic succession is defined as microbial community changes that are not the consequence of environmentally determined fitness (ecological drift). Whether microbial succession is more deterministic or stochastic is driven by several factors in the formation of the community, including birth mode, travel, diet (for example, human breast milk) and antibiotics.
Cool bioinfo
https://www.dbvis.com/thetable/
where we gather together to learn about and simplify the complexity of working with database technologies.
for example, here is how to combine mysql with docker https://www.dbvis.com/thetable/containerizing-mysql-with-docker-and-dbvisualizer/
creating beautiful command line interfaces in a composable way with as little code as necessary. https://click.palletsprojects.com/en/stable/
part of the Pallets community : https://palletsprojects.com
panGPT and panPrompt: Generative Pre-Trained Transformer for Large Pangenome Models (LPMs) from scratch. https://github.com/mol-evol/panGPT
Microbiome analysis counts several aspects, yet it always comes down at some basic concepts! Here, I will try to cover a thing or two and gather some links that describe them more thoroughly. To save some (of my) time, I will use a lot of copy-paste () always referring the initial resource
Although microbiome data has some of the attributes of compositional data, it is not perfectly compositional. Classic compositional data vectors represent portions of a whole. The total sum of the components is not meaningful, and only the relative difference between components matters [36]. For truly compositional data, the vectors (2, 1) and (2000, 1000) represent the same information: only that the first and second components are present in the ratio 2 : 1. For microbiome data, the size of the counts also contains information about the reliability of the ratio. Larger counts are more likely to closely match the true ratio in the sample [44].
Covariate Adjustment
Regression analysis, potentially with penalization for variable selection, has been used to analyze an outcome of interest modeled as a function of microbiome features.
\(p_i\) is the proportional abundance of species (i),
\(S\) is the total number of species.
The effective number of species based on Shannon entropy is: \[\text{Effective Number of Species} = e^{H'}\]
Faith’s Phylogenetic Diversity (PD)
https://danielpfaith.wordpress.com/phylogenetic-diversity/ the phylogenetic diversity of a set of species as equal to the sum of the lengths of all those branches on the tree that span the members of the set.
Faith’s phylogenetic diversity measures the amount of the phylogenetic tree covered by the community. It’s a sum of the minimum branch lengths (however you measure branch lengths). So, a higher number means more branches, means more richness (more diversity).
There are a couple of caveats (yes, I’m here to rain on the parade (). First, as a richness metric, Faith’s PD is pretty sensitive to sequencing depth. The actual value of your numbers depends on your sequencing depth, denoising method, rarefaction depth, and phylogenetic tree. The absloute magnitude is less useful as you look across datasets.
The relationship between the samples should be fairly consistent for a complex community, mostly independent of technical factors.
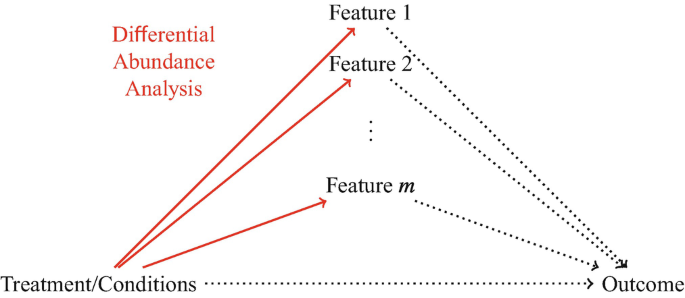
which microbiome features are impacted by treatments or environmental conditions? \(\rightarrow\) identify features whose abundances change across treatments or conditions differential \(\rightarrow\) abundance analysis
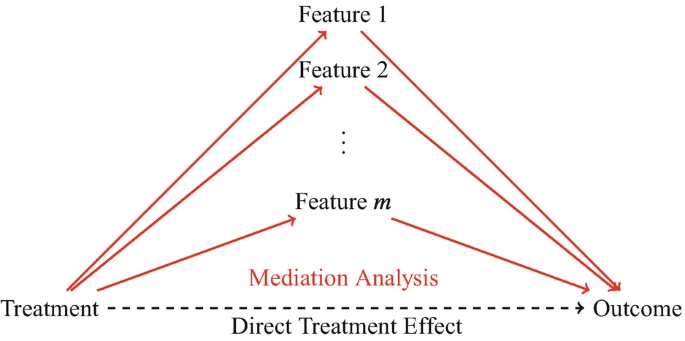
which microbiome features mediate treatment effects on an outcome? \(\rightarrow\) identify taxa affected by treatments and that because of their change the outcome of the treatment is influenced \(\rightarrow\) mediation analysis
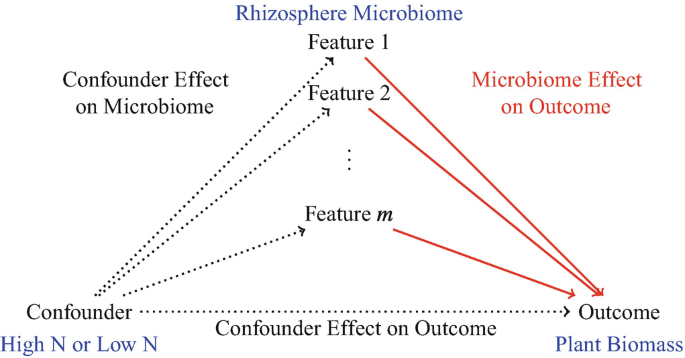
which microbiome features have an effect on an outcome, adjusting for confounders \(\rightarrow\) identify microbiome features with an effect on an outcome with no particular treatments of interest, but with potential complex confounding arising from relationships between microbes, host, and environment \(\rightarrow\) Feature Identification Adjusting for Confounding
Other concepts of diversity
microbiability
the proportion of phenotypic variance of a trait, that is explained by between-animal differences in the microbial community. From the perspective of quantitative genetics, the effect of the microbiome on a trait can be quantified by estimating the microbiability.
The fraction of phenotypic variance for a given trait that is explained by the microbiome has been estimated to quantify its influence and has been named ‘microbiability’ (b2) in symmetry with the classical ‘heritability’ (h2 ) concept
heritability estimates the degree of variation in a phenotypic trait in a population that is due to genetic variation between individuals in that population.
Differential Abundance Analysis
the null hypothesis of a differential abundance test is that treatments do not affect the mean abundance level.
Differential abundance analysis (solid lines) selects microbiome features whose abundance levels change across treatments or conditions. It only examines the relationship between treatments/conditions and microbiome features, but not the relationships involving other outcomes
Mediation analysis
high dimensionality and sparsity of microbiome data.
In case of a treatment - microbiome - outcome study, one needs to avoid differential abundance analysis as the relationships you are looking for are out of scope for DA!
Mediation analysis examines the indirect effects of treatment on the outcome through the microbiome. To determine whether a feature has a mediation effect, a method must consider both the effect of the treatment on the feature and the effect of the feature on the outcome.
Feature Identification Adjusting for Confounding
asd
Gini coefficient
Bioinformatics, Volume 34, Issue 21, November 2018, Pages 3711–3718, https://doi.org/10.1093/bioinformatics/bty373 The revival of the Gini importance? Open Access
We set up a fast approach to debias impurity-based variable importance measures for classification, regression and survival forests. We show that it creates a variable importance measure which is unbiased with regard to the number of categories and minor allele frequency and almost as fast as the standard impurity importance. As a result, it is now possible to compute reliable importance estimates without the extra computing cost of permutations. Further, we combine the importance measure with a fast testing procedure, producing p-values for variable importance with almost no computational overhead to the creation of the random forest. They had applications to gene expression and genome-wide association data, but we can use it for microbiome data as well.
Microbial phenomena that can drive you nuts!
A strain dips to very low abundance in a microbial community and then recovers to thrive
This is quite common and reflects the complex interplay of ecological, evolutionary, and environmental factors. In this page you can find some of the ways a strain might manage to survive during these low-abundance periods without going completely extinct.
We show how fast and efficient sampling dingo supports and a couple of applications of the insight you could gain.
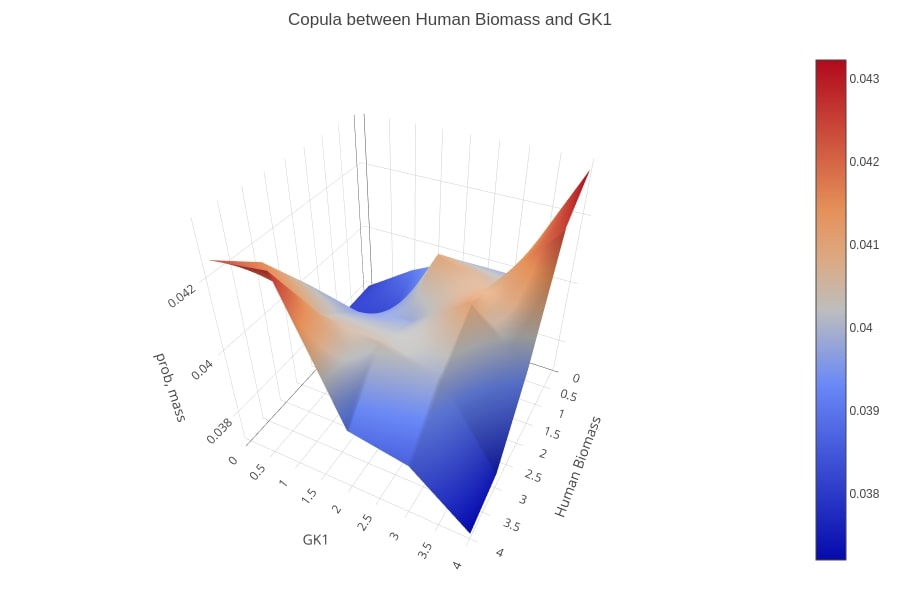
Distributions of the integrated human-virus model reactions’ flux values after maximizing for the host’s biomass function (red) and for the Virus Biomass Objective Function (VBOF) (blue). a. In case of the TYMSULT reaction, the distribution is the same for both cases b. Contrary, the flux value distribution of GK1 shifts when maximizing for VBOF.
Copula of the biomass function and the GK1 reaction flux values’ distributions, after maximizing the integrated model for VBOF. A positive dependency between the two reactions is shown as the flux of the virus biomass is low then most probably, the flux of GK1 is also low and the same applies in case of a high flux value.
microbetag implements data integration techniques to annotate both the nodes (taxa) and the edges (predicted associations) of such a network to enhance microbial co-occurrence network analysis for amplicon data.